Dataset can be viewed in the WEBGIS application of the project
Digital spectral library of vegetation type and species
Aim of this task is the collection of spectral signatures of the dominant forest species of the Taksiarchis forest. When these signatures can be generalized, they represent a single species. They can be distinguished in two types:
Static are the spectral signatures that originate from the fusion of several captures at different times or a single capture taken in one typical for the species under investigation season.
Dynamic are the spectral signatures that are collected in multiple time points, with a given time step. In this case, the spectral signatures associate with particular phenological stage of the annual cycle of natural vegetation.
In this project, dynamic spectral signatures were collected with a time step of approximately one month. Exemptions are made when bad weather do not permit collection. For the collection of the signatures a SVCHR-1024i handheld hyperspectral radiometer is used, which was bought within the project.
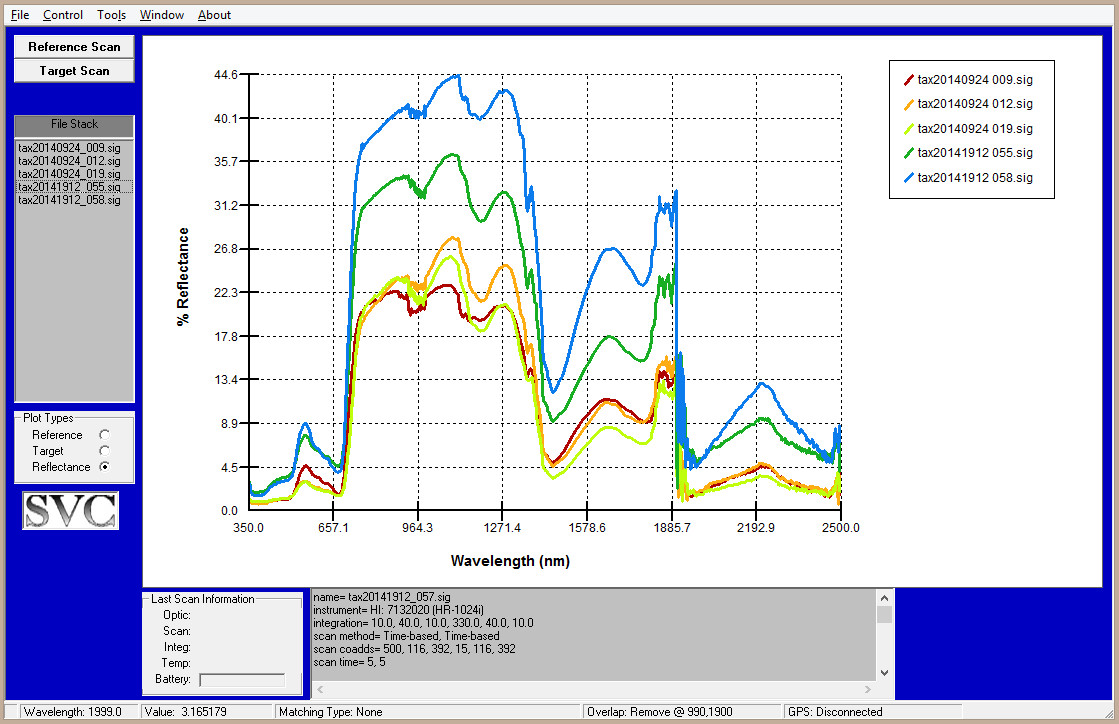 The SVCHR-1024i hyperspectral radiometer provides point recording of the reflected electromagnetic radiation, in the range 350-2500 nm, in over 1024 bands, with band range between 3.5 and 6.5 nm.Each measurement corresponds to a continuous record of reflected radiation, in this range, from a small circular surface (radius of about 5 cm), which is regarded as a single point.
The collection of signatures is an ongoing task. A part of the collected signatures have already been used for the atmospheric correction of the CASI hyperspectral image. Additionally, their analysis helps in identifying the most favorable period for various remote sensing data acquisition, so that automatic classification of different forest species is optimized. There is also an ongoing investigation of the potential signal matching between the SVCHR-1024i and CASI sensors, with very encouraging results.
Detailed description of the methodology adopted for creating the hyperspectral library of the dominant forest speciesmay be found in report 3.c
Forest species mapping using hyperspectral imagery
Forest species mapping is a prerequisite for the subsequent assessment of forest biomass. The precise and detailed mapping of forest species through remote sensing data presents considerable difficulties, particularly in the Mediterranean environments, evenwhen using very high resolution images are used. These difficulties are due to the diverse morphology of forest areas, the existence of different species of the same genus, and the inaccessibility of several areas that prevents field measurement collection.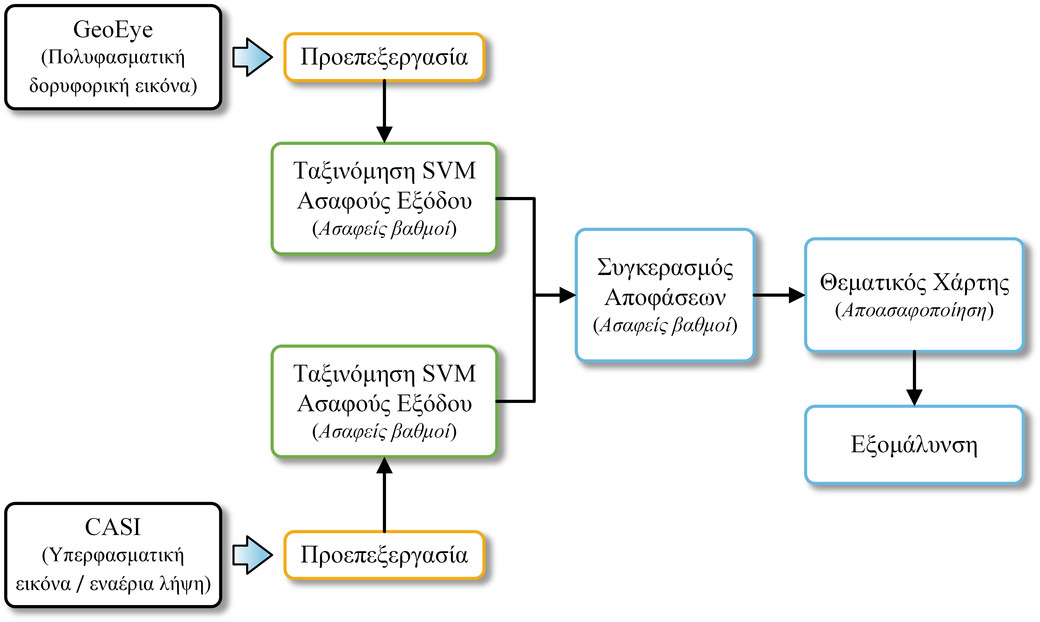
This approach proved considerably less computationally demanding than other common alternatives, such as image stacking and export of higher-order characteristics, while at the same time provided the highest classification accuracy. In the study area, the initial classification accuracies using GeoEye and CASI images were 73.41% and 77.73%, respectively. After the fusion process and the smoothing filter, the final classification accuracy was 88.82%. Regarding the two sub-classifications, this of the GeoEye image showed better results in the separation of Italian oak from beech, while the one ofthe CASI image was more successful in all other classes, and especially in the classification of the two pine species found in the area (Turkishand black pine) . The developed methodology combined the advantages of the two sub-classifications/images, leading to a thematic map with very high reliability.
Detailed description of the methodology for mapping forest types may be found in report 3.d
Related articlewas published in the Remote Sensing Journal.
Vegetation density mapping using aerial imagery
An additional necessary parameter for forest biomass estimation is the vegetationdensity. Ona first level, the number of trees was used as a measure density. This number was estimated using the aerial photographs of the National Cadastre and Mapping Agency. The applied methodology included identifying local maxima in the red image band, which were then considered ascandidate treepeaks. A watershed image segmentation algorithm was then applied, and the initial estimates were revised. This aims to prevent counting ofthe same canopy more than once.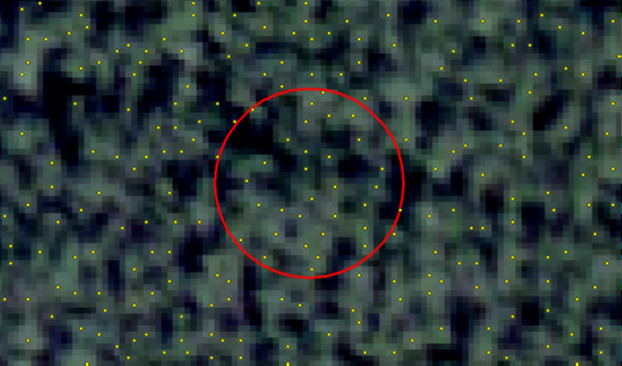
Detailed description of the methodology for assessing the number of trees may be found in the reports 4.a and 4.b
Vegetation density and chlorophyll mapping using CASI hyperspectral imagery
Vegetation density and chlorophyll mapping using CASI hyperspectral imagery
On a second level, vegetation density estimations were based on the airborne CASI hyperspectral image.
Detailed description of the methodology for mapping the vegetation density and chlorophyll basedon the CASI hyperspectral images may be found in report 4.c
Investigation of SAR methods for the estimation of average tree height of different vegetation types and species
Detailed description of the methodology for estimating the averagetree height of the vegetation types and species of the study area using SAR imagery may be found in report 5.b

")
-
February 17th, 2015 – Research group meetingThe research groups met and discussed the hitherto progress of the project, and the next steps that will lead to the successful project completion.
-
July 25th, 2014 – Article publishingPart of the project’s results were published in the article "Decision Fusion Based on Hyperspectral and Multispectral Satellite Imagery for Accurate Forest Species Mapping" in the Remote Sensing...
-
March 31st, 2014 - Article publishingPart of the project’s results were published in the article"Mediterranean forest species mapping using classification of Hyperion imagery" in the Geocarto International journal...
-
February 20th, 2014 - Article publishingPart of the project’s results were published in the article "A Comparative Analysis of EO-1 Hyperion, Quickbird and Landsat TM Imagery for Fuel Type Mapping of a Typical Mediterranean Landscape" in...
-
December 11th, 2013 – WorkshopAs part of the project, FMRS organized a workshop called 'Active Earth Observation', with both theoretical and practical parts. The training was held in English by Prof. Dr. Iain Woodhouse(University...
- More news